• Welcome to Autism Forums, a friendly forum to discuss Aspergers Syndrome, Autism, High Functioning Autism and related conditions.

    Your voice is missing! You will need to register to get access to the following site features:
    • Reply to discussions and create your own threads.
    • Our modern chat room. No add-ons or extensions required, just login and start chatting!
    • Private Member only forums for more serious discussions that you may wish to not have guests or search engines access to.
    • Your very own blog. Write about anything you like on your own individual blog.

    We hope to see you as a part of our community soon! Please also check us out @ https://www.twitter.com/aspiescentral

Anyone here a genius at math?

Oh yeah. Reminds me of my attorney coaching me on the importance of limited, concise answers in depositions ! I'd think it would be tough- stressful for you on a daily basis. Would be me...

Coaching witnesses is difficult. If people were more precise with their language and strategic with communication, then conciseness might not be a good thing. However, being strategic in the context of a deposition generally requires specialized knowledge/skills, and so coaching is necessary - not to distort the truth, but to protect attorney-client privileged information, avoid misstatements that will be used against the witness, etc., etc. I am constantly trying to nip miscommunications in the bud. "Just the facts ma'am."
 
Coaching witnesses is difficult. If people were more precise with their language and strategic with communication, then conciseness might not be a good thing. However, being strategic in the context of a deposition generally requires specialized knowledge/skills, and so coaching is necessary - not to distort the truth, but to protect attorney-client privileged information, avoid misstatements that will be used against the witness, etc., etc. I am constantly trying to nip miscommunications in the bud. "Just the facts ma'am."

I can imagine. Just the stress factor alone skews it all for me. But according to my attorney I did very well...never mind the process always makes me a nervous wreck. Pretty hard to work in insurance underwriting and be totally immune from civil suits...bad faith issues, etc..

Yeah, as clients I guess we're always a scary, unpredictable mixed bag of possibilities.
 
image.jpg
 
image.jpg
image.jpg


Why couldn't a histogram be used?
And wouldn't a pie chart kinda suck since the percentages are so close?
A dotplot could also be used.

How do I get this question right the next time?
 
A pie chart works because the pie is 100%, and the break down is 35% 25% 20% 20%, so those %'s could be listed inside their slice. Most people find this sort of chart the most easily identified relation of for slice to slice sizing. It is simply and effective so to speak.

What was the exact wording of the question? That may shed light on why the most simple and effective pie chart was the correct answer when others would work as you mentioned.
 
Could someone please tell me why C is the answer? (I want to cry!)
View attachment 12485

I took statistics a bit. I'm no genius, but I did recently take an easier version again to refresh. This question seems to be touching on the idea of the null hypothesis. A and B are opposite, and you'd think it'd have to be one of those. They trick you because apparently you have to realize that we do not know whether the lower percentage of class told to change their answers would have been a predictable result either way or not. The null hypothesis is a prediction that we can say is or is not true. What we can't do is say that something cannot happen.

For instance, you may be able to predict that the sun will rise at 5:45 AM. This statement may or may not be true at that particular time. If this statement is not true, it does not mean that the sun does not rise at all. It just means that based on the data we have, we don't have a good interpretation of the sun rising up at another time or within an interval of time without changing certain factor(s) that we are working with. Your 1st test question deals with the same type of case, but I think can be difficult to read through.
 
View attachment 12597 View attachment 12598

Why couldn't a histogram be used?
And wouldn't a pie chart kinda suck since the percentages are so close?
A dotplot could also be used.

How do I get this question right the next time?

For this one, they seem to be implying that a histogram is better for data where decimals would be considered, aka data on a continuous curve. A dot plot might have too many dots to count. A pie graph uses discrete numbers (no decimals, just integers) and I think this is how you would tell the difference. By knowing your number types and how each graph relates to a particular number type in general. (I think)
 
For this one, they seem to be implying that a histogram is better for data where decimals would be considered, aka data on a continuous curve. A dot plot might have too many dots to count. A pie graph uses discrete numbers (no decimals, just integers) and I think this is how you would tell the difference. By knowing your number types and how each graph relates to a particular number type in general. (I think)

Thank you for answering, Paloftoon. I'll call you Palo for short. The test is tomorrow. I just went ahead and memorized the answer. I still don't understand that a histogram couldn't be used - especially since a Pareto chart could be used. I just need to pray.
 
Thank you for answering, Paloftoon. I'll call you Palo for short. The test is tomorrow. I just went ahead and memorized the answer. I still don't understand that a histogram couldn't be used - especially since a Pareto chart could be used. I just need to pray.

It's not that a histogram could not be used. It's that there are better or supposedly better options to be able to read the data more clearly or precisely from quick glance.
 
I'm pretty good at math, wouldn't call myself a genius though.

You can find lots of math funnies at www.xkcd.com :)

How did your test go?

I had posted this in the "How do you feel today" thread, but it probably should have been here.

WOO HOO!!!!!!!!!!!!!!!!!!!!!!!!!!!!!!!!!!!!!!!!!!!!!!!!!!!!!!!!!!!!!!!!!!!!!!!!!!!!!!!!!!!!!!!!!!!!!!!!!!!!!!!!!!!!!!!!!!!!!!!!!!!!!!!

I MADE A 98% ON MY FIRST STATISTICS TEST!!!!!!!!!!!!!!!!!!!!!!!!!!!!!!!!!!!!!!!!!!!!!!!!!!!!!!!!!!!!!!!!!!!!!!!!!!!!!!!!!!!!!!

:):):):):):):):):):):):):):):):):):):):):):):):):):):):):):):):):):):):)

I celebrated with fattening potato salad, fattening cole slaw and fattening Zarda baked beans with Sloppy Joe!!!!

Thanks for asking!!! :)
 
This is actually being used as a question on my statistics final.
Who the hell dies from getting tangled in their bedsheets???!!! :eek:
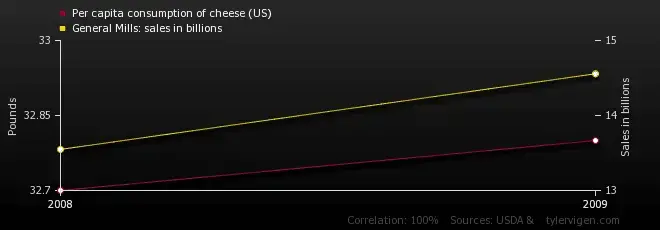
There's no causal relationship between the two, but as you can see those numbers for bedsheet deaths come from the CDC!
That would really piss me off if my death was caused by my damn bedsheets!!!

Per capita consumption of cheese (US)
correlates with
Number of people who died by becoming tangled in their bedsheets


2000 2001 2002 2003 2004 2005 2006 2007 2008 2009
Per capita consumption of cheese (US)
Pounds (USDA)
29.8 30.1 30.5 30.6 31.3 31.7 32.6 33.1 32.7 32.8
Number of people who died by becoming tangled in their bedsheets
Deaths (US) (CDC)
327 456 509 497 596 573 661 741 809 717
Correlation: 0.947091
 

Attachments

  • per-capita-consumption-of-cheese-us_general-mills_-sales-in-billions.png
    per-capita-consumption-of-cheese-us_general-mills_-sales-in-billions.png
    5.9 KB · Views: 244
I just found out I got an A in my Statistics class!!!!! Thank you Jesus!!!!!!!!!!!!!!!!!!!!!!!!!!!!!!!!!!!!
!!!!!!!!!!!!!!!!!!!!!!!!!!!!!!!!!!!!!!!!!!!!!!!!!!!!!!!!!!!!!!!!!!!!!!!!!!!!!!!!!!!!!!!!!!!!!!!!!!!!!!!!!!!!!!!!!!!!!!!!!
!!!!!!!!!!!!!!!!!!!!!!!!!!!!!!!!!!!!!!!!!!!!!!!!!!!!!!!!!!!!!!!!!!!!!!!!!!!!!!!!!!!!!!!!!!!!!!!!!!!!!!!!!!!!!!!!!!!!!!!!!!
!!!!!!!!!!!!!!!!!!!!!!!!!!!!!!!!!!!!!!!!!!!!!!!!!!!!!!!!!!!!!!!!!!!!!!!!!!!!!!!!!!!!!!!!!!!!!!!!!!!!!!!!!!!!!!!!!!!!!!!!!!
:):):):):):):):):):):):):):):):):):):):):):):):):):):):):):):):):):):):):):):):):):):):):):):):):):):):):):):):):):):):):):):):):):):):):):):):):):):):):):):):):):):):):):):):):):):):):)
 
Good for you, nurseangela! Your ability to judge the quality of the questions might have translated to earning the A grade in statistics class!

I guess it won't be that easy to forget how some of the questions bothered you in the past, how some had nothing to do with nursing - but now you can rest a lot easier!!
 

New Threads

Top Bottom